

Amazon: The Global Infrastructure Utility of the AI Era
Why a $200 Billion Capex Plan is the Ultimate Moat in a World of Short-Term Noise

Markets have a short attention span. At any given moment, capital flows toward whatever story feels most urgent. Today, it is Generative Artificial Intelligence; yesterday, it was the post-pandemic retail recovery; before that, it was zero-rate growth. Each cycle produces winners, but it also creates blind spots where high-quality businesses keep compounding quietly while the crowd fixates on short-term fluctuations.
Amazon ($AMZN) is often the protagonist of market narratives, yet it remains fundamentally misunderstood. Critics frequently slam its aggressive spending—most recently, its staggering $200 billion capex forecast for 2026. But much like the Mastercard analysis we recently published, Amazon has evolved into something far more valuable for long-term investors: it has become the indispensable infrastructure for both global commerce and the digital economy.
To analyze whether this "$200 billion shock" is a red flag or a generational opportunity, I have turned to the Finorify app. Just as we did with Mastercard, Finorify helps us strip away the market noise and focus on the fundamental health of the business. By using Finorify’s visualization tools, we can see exactly where the cash is going and, more importantly, what it is building.
The Capex "Shock"
In the world of investing, there are numbers that catch your eye, and then there are numbers that stop you in your tracks. Amazon’s announcement of a $200 billion capex plan for 2026—a staggering 50% increase from its already massive 2025 levels—sent a shockwave through the market.

To the casual observer, this looks like reckless spending that threatens to turn free cash flow negative. However, if you have followed Amazon since its early days, you know that CEO Andy Jassy is playing the same long game as Jeff Bezos once did. This isn’t just spending; it is a calculated land grab for the next decade of compute.
As Gene Munster of Deepwater Asset Management recently noted, roughly 80% of this capex is likely AI-related, including the massive infrastructure needed to prevent Amazon from being outbuilt by rivals like Microsoft and Google. Munster argues that “the brain of AI is getting bigger,” and this investment will yield a utility and level of disruption that will eventually “play over to everything”.
Jassy himself addressed this “Visionary’s Dilemma” during the Q4 call, stating that Amazon is “monetizing capacity as fast as we can install it”. Unlike previous cycles where capacity might sit idle, this AI infrastructure is “immediately useful” to a backlog of customers that has pushed AWS’s revenue backlog to a record $244 billion, up 40% year-over-year.
Following the Money
One of the simplest ways to understand a business like Amazon is to stop listening to quarterly narratives and instead follow the money over time.
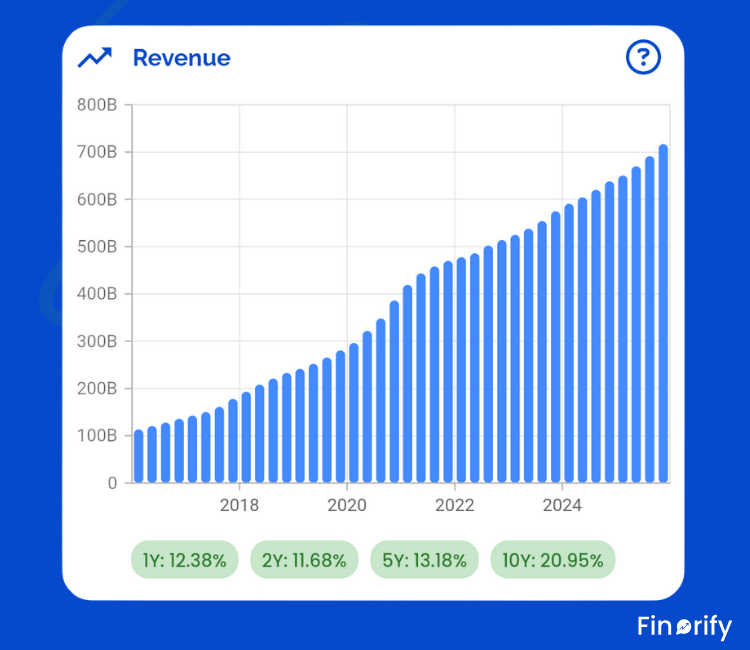
Looking at the Finorify app, Amazon’s annual revenue progression is a testament to the power of a multi-layered moat. Amazon continues to shatter expectations with record-breaking momentum:
Full-Year 2025 Revenue: $716.9 Billion. Growth: Up 12% year-over-year.
Q4 2025 Revenue: $213.4 Billion. Impact: A historic quarter driven by peak holiday demand and AWS acceleration.
What stands out in the Finorify data is the consistency of growth across its diverse segments:
• AWS: Sales increased 24% in Q4 to $35.6 billion, marking its fastest growth in 13 quarters.
• Advertising Services: Grew 22% to $21.3 billion in the quarter.
• Third-Party Seller Services: Increased 11% to $52.8 billion, with third-party units making up 61% of total units sold.
If you want to explore this revenue breakdown interactively, this exact visualization is available inside the Finorify app. Seeing these trends laid out visually often makes the long-term story much clearer than reading earnings headlines ever could.
Profitability: The Real Story Behind the Margins
Revenue growth tells you where a business is going. Profitability tells you how strong it is while getting there.
While revenue figures are staggering, Amazon’s ability to convert that scale into bottom-line profit is what the market is truly watching. For Q4 2025, Amazon reported a worldwide operating income of $25.0 billion.
However, this figure carries some “one-time” weight. The total included $2.4 billion in special charges stemming from:
Tax disputes in Italy
Global severance costs
Specific asset impairments
By stripping these non-recurring charges away, we see an “adjusted” operating income of $27.4 billion—a new all-time record for the company.
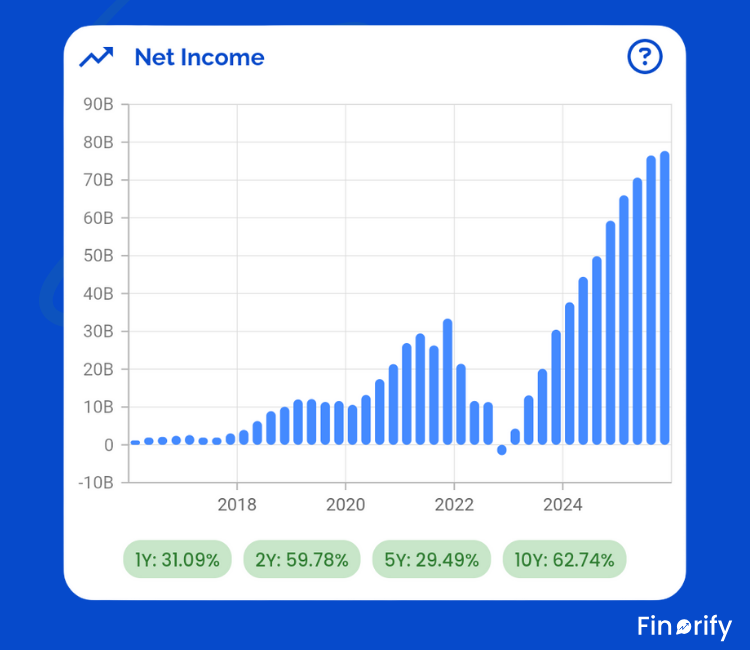
The Net Income chart provides the necessary “zoom out” to understand why these quarterly records are so significant:
The Post-2022 Recovery: After a brief dip into negative territory in early 2023, Amazon’s net income has entered a “parabolic” phase.
Massive Efficiency Gains: The chart shows a consistent, steep climb throughout 2024 and 2025, with net income now approaching the $80B annual run-rate mark.
Long-Term Growth Rates: Finorify highlights staggering compounded growth, including a 59.78% 2-year growth rate, proving that Amazon is successfully extracting massive margins from its AWS and Advertising segments.
The “Visionary’s Dilemma” Andy Jassy faces is being funded by the most profitable era in Amazon’s history. As the chart illustrates, the company isn’t just spending $200B on Capex—it is generating the historic net income required to bankroll it.
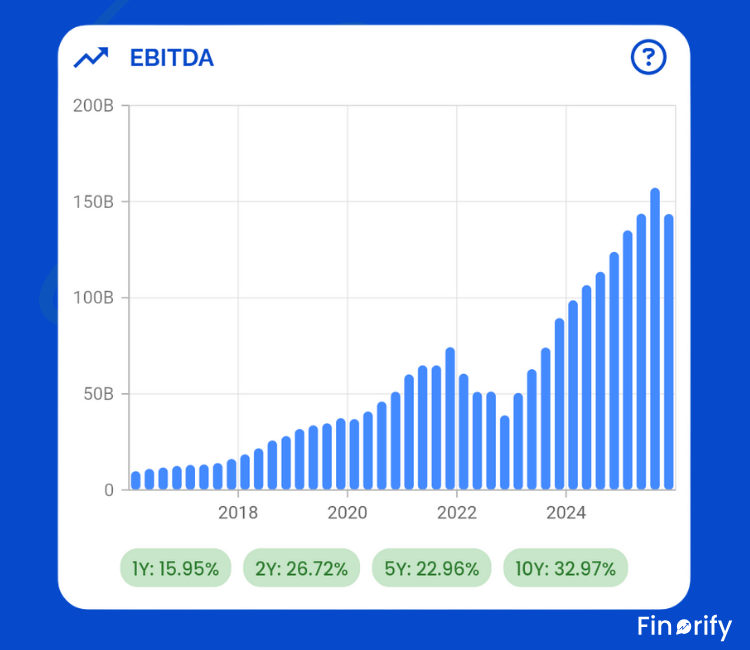
The EBIDTA chart highlights that Amazon’s operational efficiency is expanding alongside its infrastructure:
Parabolic Growth: Amazon’s EBITDA has seen an aggressive climb, particularly over the last two years, reflecting a 26.72% 2-year growth rate.
A New Baseline of Profit: After hovering around the $50B mark in 2022, the company’s trailing EBITDA has surged past $150B as of the most recent peak.
Long-Term Resilience: Even with the massive scale of 2026 capex plans, the 10-year growth rate of 32.97% suggests that Amazon is historically adept at turning capital investment into cash-flow powerhouses.
AWS and the AI Arms Race
The crown jewel, AWS, has officially entered its second act. After a period where customers focused on “cost optimization,” growth has accelerated to 24%. AWS is now a $142 billion annualized run rate business.
Gene Munster emphasizes that we are only at the “very beginning of the transformation around AI”. He argues that the market’s “hostility” to the $200 billion capex miss the central point: the “brain of AI is getting bigger,” and this spending will yield massive utility and disruption.
Amazon’s AI strategy is built on a “top-to-bottom” stack:
The Infrastructure Layer (Amazon Bedrock): Bedrock has already achieved a multi-billion dollar run rate. It functions as a foundational platform where customers can choose between industry-leading models like Anthropic’s Claude, Meta’s Llama, and Amazon’s own high-performance model, Nova.
The Custom Silicon Layer (Chips): Amazon is reducing its reliance on third-party hardware through its custom chips, Graviton and Trainium. This business now exceeds a $10 billion annual revenue run rate and is growing at triple-digit percentages, providing customers with better price-performance than standard commodity hardware.
The Application & Agent Layer: Amazon is embedding AI directly into the user experience. This includes Rufus, an AI shopping assistant already used by 300 million people, and Amazon Q, a generative AI-powered assistant for businesses and developers.
Logistics Dominance
While the “cloud” gets the headlines, the “dirt” (logistics) is where Amazon wins the daily battle for the consumer. In 2025, Amazon achieved its fastest delivery speeds ever, delivering nearly 70% more items same-day in the U.S..
This efficiency is driven by regionalization. By breaking the U.S. network into 10 distinct regions, Amazon has reduced travel distances, which lowers costs and increases speed. This has allowed Amazon to dominate “Everyday Essentials,” which grew twice as fast as other categories and now represents one out of every three units sold.
SWOT Analysis
Based on the latest earnings call and expert analysis, here is the current state of the empire:
Strengths:
AWS Acceleration: Fastest growth in 13 quarters on a massive $142B base.
Advertising Powerhouse: $21.3B quarterly revenue with high margins and trillions of shopping signals.
Vertical Silicon Integration: $10B+ run rate in custom chips (Trainium/Graviton) provides a unique cost moat.
Logistics Dominance: Fastest delivery speeds ever; regionalization driving down cost to serve.
Weaknesses:
Free Cash Flow Squeeze: Massive capex is suppressing near-term FCF, which dropped to $11.2 billion TTM from $38.2 billion.
Thin International Margins: Operating margin of 2.1% in the international segment is still maturing.
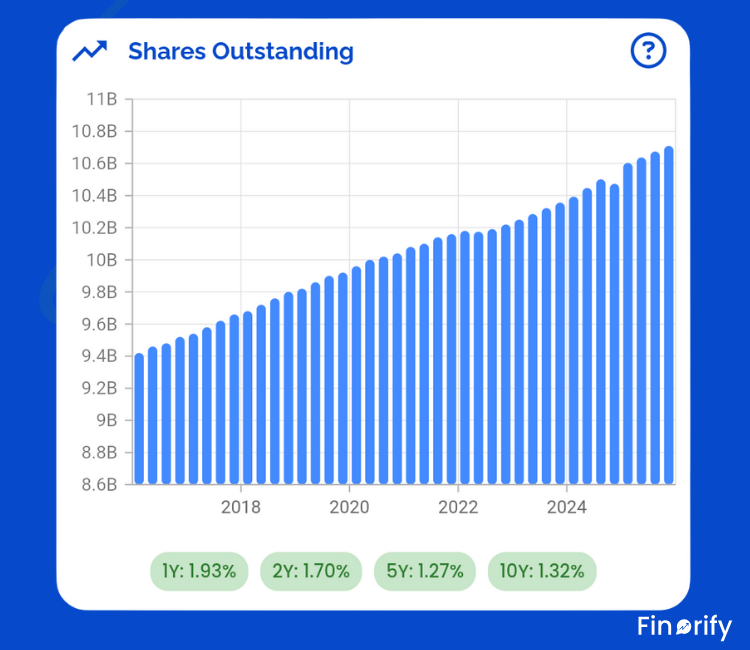
Shareholder Dilution: Amazon continues to increase its share count by roughly 1% annually through stock-based compensation.
Free Cash Flow and the “SBC Trap”
One of the biggest traps in financial analysis is taking Free Cash Flow (FCF) at face value. While FCF is often touted as the ultimate metric for “owner earnings,” it can be highly volatile—especially during massive infrastructure cycles like the one Amazon is currently navigating.
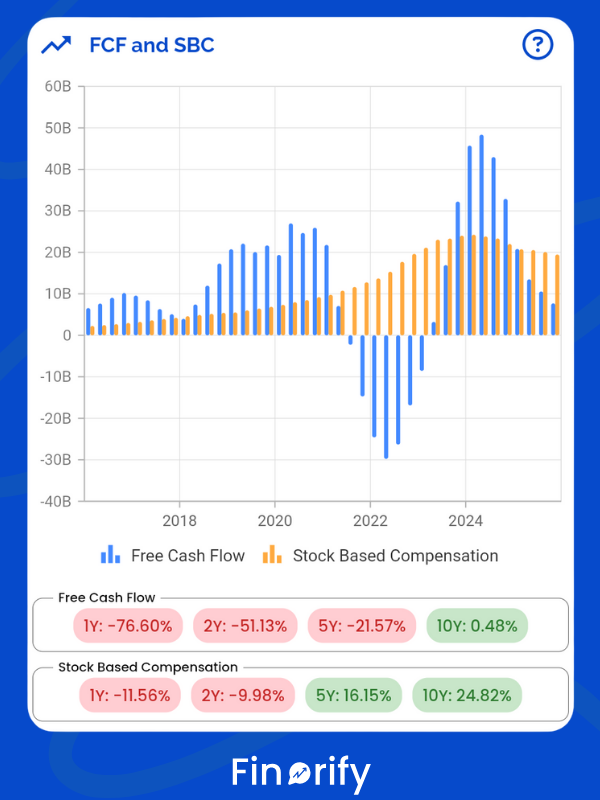
As shown in the Finorify FCF and SBC chart, Amazon’s trailing 12-month free cash flow has decreased to $11.2 billion. This dip is primarily driven by a staggering $131.8 billion in property and equipment purchases (Capex), representing the infrastructure “land grab” for AI and AWS capacity.
The Role of Stock-Based Compensation (SBC)
The “trap” arises when investors ignore how much of that cash flow is offset by issuing new shares to employees.
Recent Trends: Using the Finorify visualization, we can see that SBC decreased almost 12% in Q4.
The Dilution Factor: Despite this quarterly dip, SBC remains a consistent ~1% annual dilution factor for shareholders.
True Owner Earnings: Finorify allows you to visualize FCF alongside SBC (the yellow bars vs. blue bars) to see how much cash actually remains after accounting for the “invisible” cost of equity compensation.
Profitability vs. Cash Flow: The Strategic Buffer
While the FCF chart shows a sharp 76.60% 1-year decline due to heavy spending, Amazon’s underlying profitability tells a different story of strength:
EBITDA Resilience: Amazon’s EBITDA continues its upward trajectory with a 26.72% 2-year growth rate, reaching levels near $150 billion. This provides the massive operational “buffer” needed to fund the $200 billion 2026 capex plan.
Net Income Surge: Similarly, Net Income has seen a parabolic recovery, with a 59.78% 2-year growth rate.
By overlaying these metrics, it becomes clear that Amazon isn’t “running out of money.” Instead, it is intentionally converting record-breaking Net Income and EBITDA into long-term assets, causing a temporary, calculated dip in Free Cash Flow.
Finorify is designed to surface these nuances at a glance, ensuring you don’t mistake a strategic investment cycle for a fundamental business decline.
A Balance Sheet Built for the Long Game
Despite the staggering $131.8 billion recently directed toward property and equipment, Amazon maintains a capital structure built for market uncertainty and high-stakes technological shifts.
The “Net Cash” Fortress
As of December 31, 2025, Amazon’s liquidity position remains a strategic asset. By visualizing the Finorify Cash and Debt chart, we can see a clear divergence between the company’s reserves and its obligations:
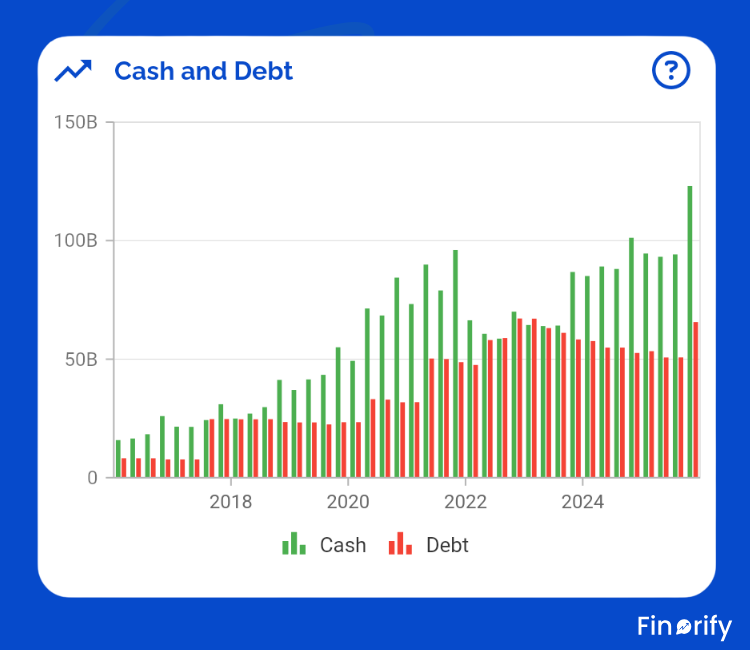
Liquidity Powerhouse: Amazon held $123 billion in cash, represented by the dominant green bars in the Finorify dashboard.
Manageable Leverage: Total long-term debt stood at $65.6 billion.
Healthy Net Cash Position: This leaves the company with a significant cash cushion, allowing it to remain on the offensive.
The Finorify data reveals that Amazon isn’t just spending aggressively; it is spending from a position of historical strength. While the Free Cash Flow chart shows the immediate impact of these investments, dropping 76.60% over the last year due to the massive $131.8B spend, the cash-to-debt ratio ensures that the company’s “land grab for compute” is backed by one of the most robust balance sheets in the world.
By using Finorify to overlay cash reserves against total debt, it becomes clear that Amazon has the “advantaged financials” necessary to win the AI arms race while maintaining its independence from shifting credit markets.
Valuation: Is the Dip a Gift?
To determine if this is a “gift” for investors, we must look at the quality of the earnings backing that 33x multiple.
The Earnings Powerhouse
The Finorify Net Income chart reveals that Amazon’s “earnings dip” of 2022-2023 is a distant memory.
Parabolic Growth: Net income has entered a parabolic phase, sporting a 59.78% 2-year growth rate.
Historical Context: While a 33x P/E might seem high for a legacy retailer, it is exceptionally low for a tech giant growing its bottom line at a 10-year compounded rate of 62.74%.
Intrinsic Value and the DCF Gap
A Discounted Cash Flow (DCF) model, which values a company based on the present value of its future cash flows, estimates Amazon’s intrinsic value at $245 per share.
The 16% Upside: This suggests the market is currently underpricing Amazon by roughly 16%, likely due to fears over the $200 billion capex plan.
EBITDA as a Proxy: The EBITDA chart supports this higher valuation, showing a steady climb to an annualized run-rate exceeding $150 billion. With EBITDA growing at 26.72% over the last two years, the “cash engine” remains highly efficient.
Understanding the “Capex Dip”
The primary reason for the valuation gap is the optics of Free Cash Flow (FCF).
The FCF Illusion: As the Finorify FCF chart shows, trailing 12-month FCF has dropped 76.60% in the last year.
Strategic Reinvestment: This isn’t a loss of profitability, but a massive shift of $131.8 billion into property and equipment to secure the “land grab” for AI compute.
Conclusion: Owning the Infrastructure of Tomorrow
Owning Amazon today is not a bet on the next quarter’s EPS or a move to “time the bottom” of a spending cycle. It is a strategic decision to own a piece of the primary global infrastructure for the AI era.
The Balance Sheet Buffer: Amazon’s $86.8 billion in cash ensures it can finish this build-out without taking on restrictive levels of debt, as long-term debt remains stable at $65.6 billion.
The Long Game: The $200 billion price tag is high, but it is the cost of entry to build the most powerful combined compute and commerce engine in history.
For investors who want to understand these fundamentals visually and compare Amazon with other high-quality compounders, this is exactly what Finorify is built for. Seeing the full picture, the divergence between falling FCF and rising EBITDA, leads to better long-term decisions than reacting to short-term market noise.