

This Is the Mistake Investors Keep Making
Four companies that show why short-term thinking fails

Financial markets are incredibly efficient at processing information quickly. They are far less efficient at interpreting that information correctly. Most long-term investment mistakes do not come from missing data, but from misunderstanding context.
Every quarter, investors react to earnings misses, margin compression, declining free cash flow, or rising capital expenditures. Headlines amplify fear. Prices adjust rapidly. And yet, when you zoom out and examine revenue trends, cash generation, and capital allocation, the underlying business reality often tells a very different story.
This article is a deep dive into four companies where short-term narratives obscured long-term fundamentals: Netflix, Meta Platforms, Amazon, and S&P Global. These businesses operate in very different industries, but they share a common pattern. Each was punished for temporary effects while their long-term earnings power continued to strengthen.
The goal of this post is not to make short-term predictions. It is to show how to think clearly when the market gets distracted.
WHY HEADLINES CONSISTENTLY MISLEAD INVESTORS
Markets love clean narratives. “Earnings missed.” “Margins collapsed.” “Free cash flow is down.” These statements are easy to understand and easy to trade on. What they often ignore is why those numbers changed.
Accounting rules, tax settlements, and timing effects can dramatically alter reported earnings without changing the economics of a business. Investment cycles can depress cash flow today while increasing future earnings power. When investors treat these effects as permanent, mispricing emerges.
The key skill of long-term investing is separating signal from noise. Signal lives in multi-year revenue trends, operating leverage, and capital allocation. Noise lives in quarterly fluctuations and one-off events.
NETFLIX: ACCOUNTING NOISE AND STRATEGIC SCALE
Netflix dropped hard after the last earnings report, mainly because of a one-off tax charge in Brazil that hit its reported profit and margins. The market focused on the headline miss, not on how strong the underlying business still looks. That selloff gave me the chance to buy shares around 92 dollars recently.
The Brazil tax and the “earnings miss”
In the latest quarter, Netflix booked a large non-income tax expense related to an old dispute in Brazil. This charge pulled down earnings and made the quarter look much weaker than it really was.
If you adjust for this one-time item, both earnings and operating margin would have been clearly higher. Revenue was still growing in the mid-teens year over year, which shows that demand for the service remains strong. For me, that is not a broken business story, it is a noisy accounting story.
Why the Warner deal matters
For most of its history, Netflix became the leader in streaming without owning the classic Hollywood IP that old studios have. It relied on original content and smart product design rather than big legacy franchises.
Now the strategy is changing. Netflix has agreed to buy Warner Bros. Discovery’s studios and streaming business, which includes HBO and a deep library of iconic titles. If this deal closes, Netflix will control franchises like Harry Potter, Game of Thrones and DC heroes such as Batman, together with many other valuable movies and series.
It is important to be precise here. The deal is agreed but it is not completed yet. It still needs to pass regulatory and structural steps before Netflix actually owns these assets.
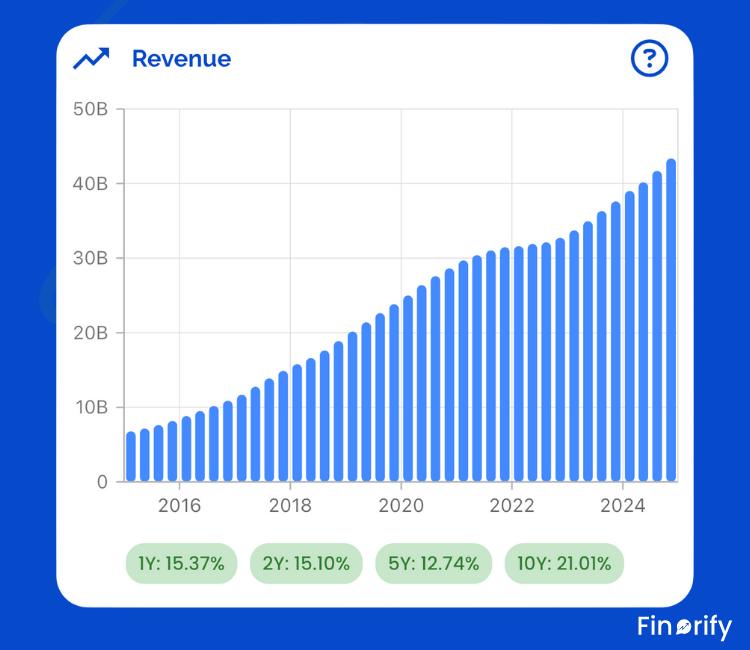
Netflix TTM revenue has grown steadily from under 8 billion dollars in early 2016 to over 43 billion dollars by late 2025, with a brief slowdown around 2022 before accelerating again. Recent quarters show about 15-17% year-over-year growth, confirming the strong top-line momentum even amid the tax noise.
Fundamentals beneath the headlines
The core business is still moving in the right direction. Revenue is growing strongly and the underlying operating margin is trending higher if you remove the Brazil tax noise. Earnings growth would have looked much faster on a like-for-like basis without that single charge.
Management has also raised or confirmed margin targets compared with a few years ago, which shows the benefit of scale. The platform is now large enough to spread content and technology costs over a huge base of subscribers and advertisers.
Valuation and why I am buying
On valuation, Netflix trades below its own history.
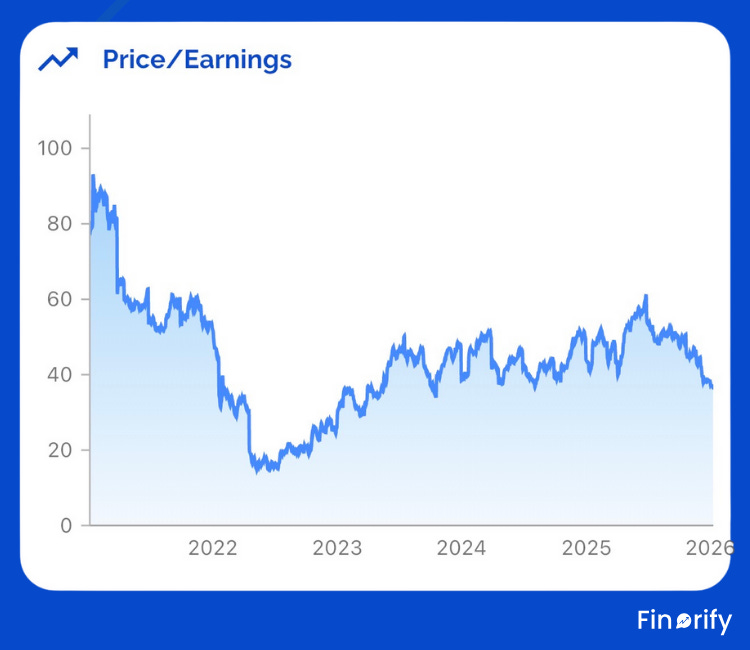
The quarterly TTM PE ratio over the last 5 years has swung from a low of about 15 times in mid-2022 to peaks above 50 times, with a rough median around 40 times; current levels near 36x offer a discount to earlier highs.
For a company that can still grow revenue at a healthy double-digit rate and expand margins, that does not look expensive to me. If earnings keep compounding and the Brazil tax issue fades into the past, either the multiple can move back up or I can still do well just from earnings growth alone.
That is why the post-selloff level around 90 dollars per share looked attractive for starting and potentially adding to a position over the next months.
If you want to understand Netflix beyond headlines and one-off earnings noise, the fastest way is to look at the data visually.
In Finorify, you can:
Track Netflix’s quarterly TTM revenue growth over the last decade
See how valuation multiples move with sentiment, not fundamentals
👉 Explore Netflix fundamentals in Finorify:
https://finorify.com/app/stockDetail?stockRef=NFLX
META PLATFORMS: AI IS ALREADY MONETIZING
Meta’s stock fell hard in the second half of 2025 due to heavy AI spending and doubts about quick returns from those investments. But the market misses the point: revenue growth proves AI is already boosting ads and keeping users hooked longer. Fundamentals stay strong despite a one-time tax hit on reported profits.
Revenue growth shows AI at work
People say there is no clear income from AI yet, but that ignores the numbers. Q3 2025 revenue jumped from 40.6 billion dollars in Q3 2024 to 51.2 billion dollars, a clean 26% gain at a huge scale. Ad impressions rose 14% year over year, and price per ad climbed 10%, making the business more effective.
AI powers this through better algorithms that hold users on Facebook, Instagram, and WhatsApp longer while targeting ads smarter. No need to wait for “future” impact, we see it in the growth right now.
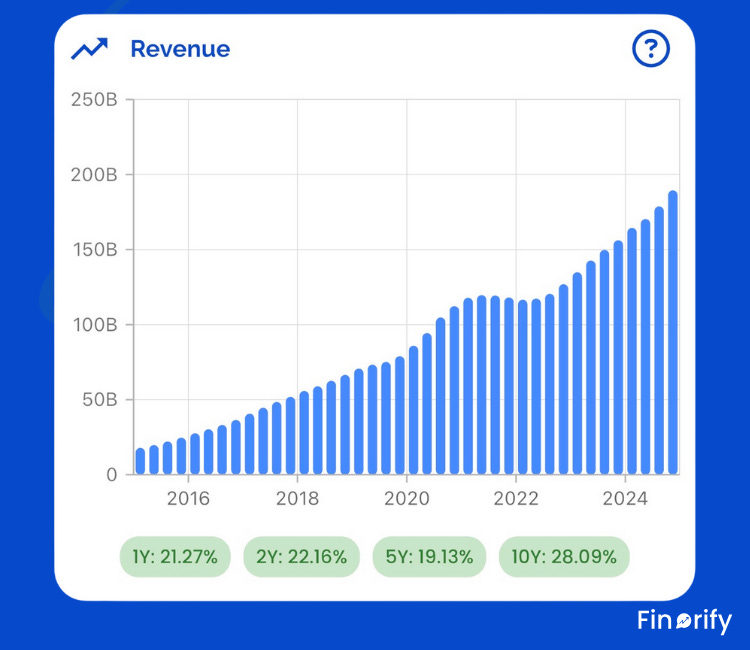
Key points include 27.6 billion dollars (2016), 70.7 billion dollars (2020), 134.9 billion dollars (2023), and 164.5 billion dollars annual 2024, now at 189.5 billion dollars TTM. Growth averaged 25-30% in strong years, with the recent 22% jump standing out even at scale.
The tax hit and true profits
Net profit dropped on paper because of a non-cash change in tax accounting rules. This was a one-off adjustment, not a real cash drain on the business. The CFO even said future effective tax rates will come down from here, so reported earnings should look better going forward.
Operating income and free cash flow tell the real story: both hit records in 2025, with cash generation over 70 billion dollars even amid capex ramp-up to 64-72 billion dollars for AI data centers.
Capex fears vs market reality
High capex spooked investors, but this is smart spending on AI models like Llama, tools that already drive ad gains, and infrastructure to stay ahead. WhatsApp now has over 3 billion users, and monetization there is starting to kick in alongside Threads growth.
The stock dropped about 25% from its peak after Q3 guidance raised AI spend, but shares are only up around 6% for full-year 2025. That lags the S&P 500 but sets up a discount for 2026, with analysts eyeing 20-40% upside on 20%+ revenue growth.
Why buy the disconnect
Meta trades at a forward P/E below 22x despite 25%+ revenue jumps and improving margins from AI leverage. From 20 billion dollars TTM revenue in 2016 to almost 190 billion dollars today, the business scaled massively while sustaining high growth rates. If capex peaks and tax normalizes, earnings could compound fast while robotics glasses like Ray-Ban Meta triple sales again. This is classic growth at a value price.
Meta’s AI story is already visible in revenue, margins, and engagement, but it gets lost in earnings headlines.
With Finorify, you can:
Visualize AI-driven revenue acceleration over time
Compare operating margins before and after the AI rebound
Spot valuation disconnects as sentiment shifts
👉 Analyze Meta with Finorify charts further:
https://finorify.com/app/stockDetail?stockRef=META
AMAZON: WHY FREE CASH FLOW IS THE WRONG METRIC IN AN INVESTMENT CYCLE
Amazon is going through a big spending phase to build out AWS capacity for booming AI demand, which is the best kind of capex for a company like this. While investors worry about falling free cash flow, the real story is in the surging operating cash flow and high-margin growth from AWS and ads. The stock only rose barely last year despite strong fundamentals, creating the kind of gap worth leaning into.
The capex cycle and cash flow story
Amazon’s free cash flow has dropped recently as capex surges to meet AWS demand, especially for AI infrastructure. This is not a sign of weakness, it is a sign of opportunity, with planned capex around 100 billion dollars or more in 2025-2026.
Look at operating cash flow instead, which strips out those investments. It grew strong in the 30-40% range year over year in recent periods, hitting records like 115 billion dollars in 2024. That shows the business generates plenty of cash before funding the next growth wave.
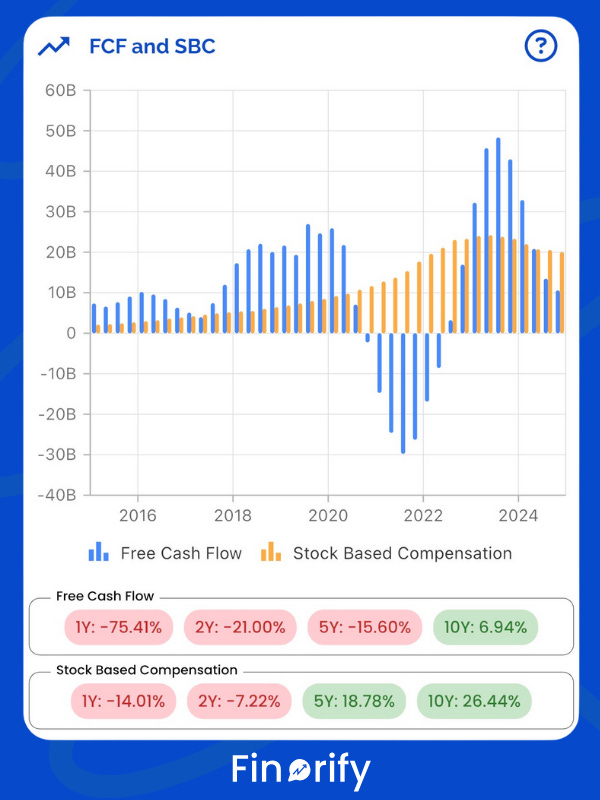
Amazon’s annual free cash flow swung from negative in 2021-2022 to a peak of 49 billion dollars in 2024, then fell to about 10 billion dollars in 2025 due to higher capex, while stock-based compensation stayed stable near 20-21 billion dollars. The SBC level is high but steady, and the FCF drop ties more to investments than compensation run-up.
High-margin engines driving profits
Net income and operating income have soared, thanks to fast growth in AWS and advertising, which have much better margins than e-commerce. AWS revenue grew 20% in the latest quarter, while ad revenue jumped 24%.
These segments pull up overall profitability even as retail grows more slowly. Operating income held steady or improved when adjusting for one-offs, with AWS leading the charge.
The 2025 disconnect and future upside
Amazon’s stock gained just around 5% in 2025, badly trailing the S&P 500’s 16.4% rise, even as sales hit around 638 billion dollars with 11% growth. This lag happened despite the profit surge from high-margin areas.
Analysts still see upside, with targets implying 15%+ gains, but the market worries about capex intensity and AWS acceleration. That caution ignores the robotics push in warehouses, low-earth-orbit LEO satellites for broadband, and self-driving tech bets that could unlock even more value down the line
Free cash flow alone doesn’t explain Amazon. You need to see operating cash flow, capex, and margins together.
In Finorify, you can:
Separate investment cycles from real profitability
Track AWS and advertising growth drivers visually
Understand why cash flow dips can precede earnings expansion
👉 Break down Amazon fundamentals in Finorify:
https://finorify.com/app/stockDetail?stockRef=AMZN
S&P GLOBAL: THE QUIET COMPOUNDER
S&P Global flies under the radar compared to flashy tech names, but it runs one of the world’s most steady businesses with a massive competitive edge. Like Mastercard, it collects a toll every time companies or governments issue debt through credit ratings. S&P and Moody’s share about 80% of that market, and lower interest rates now should bring more bond deals their way.
The rating business moat
Whenever someone wants to borrow big, they need a rating from S&P Global or Moody’s. This duopoly gives them huge pricing power and steady fees no matter the economy. Even when rates were high, the company kept growing fast thanks to the IHS Markit deal.
In 2022, S&P bought IHS Markit for 44 billion dollars in an all-stock transaction. That merger boosted their data and analytics side, creating more tools for clients and cutting competition. Now about 75% of revenue comes from subscriptions, making earnings very predictable.
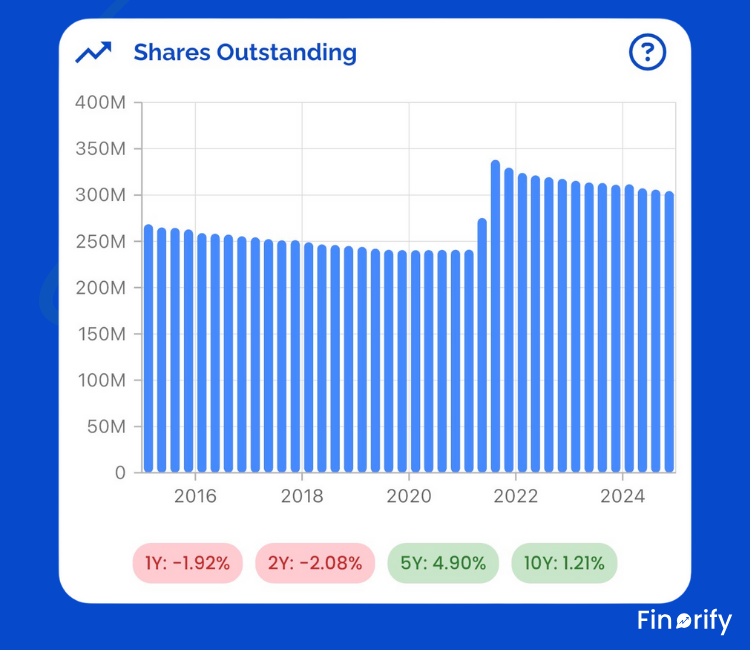
You can see the impact clearly. Shares peaked right after the deal due to all-stock issuance, then steadily declined to about 305 million by early 2026 through aggressive buybacks. Management took on debt and bought back shares hard, shrinking the count in three years. That returns real value to owners while boosting earnings per share.
Growth despite tough times
The IHS deal showed up clearly in shares outstanding, which jumped, then the company loaded up on debt but used it smartly for buybacks. That returned cash straight to owners while they integrated the businesses. Revenue kept climbing even in high-rate years, proving the model’s strength.
With rates now falling, bond issuance should pick up, feeding directly into higher fees. Ratings benefit a lot from this cycle, unlike many others hurt by tight money.
Valuation discount after flat 2025
This reliability comes with a catch: the stock often trades at premium prices. The average trailing PE over the last 5 years sat around 38 times earnings. But without AI hype or big media buzz in 2025, shares rose just around 9%, lagging the market.
That pulls the forward PE down to about 26 times, a sharp discount to history for a business growing earnings at 13% plus into 2026. Analysts see EPS at 17.74 dollars next year, up from current levels. At these multiples, you get quality growth without overpaying.
Why it fits a steady portfolio
S&P Global offers resilience few stocks match: wide moat, recurring cash, and tailwinds from easier rates. The IHS merger turned good into great, and buybacks shrink shares while padding returns. The chart proves they walk the talk, cutting shares from merger peak to 305 million today. If bond volumes rise as expected, this tollbooth keeps printing money quietly.
S&P Global doesn’t look exciting on headlines. Its power shows up in share count and per-share growth.
With Finorify, you can:
Follow shares outstanding shrinking over time
See how buybacks boost earnings per share quietly
Analyze recurring revenue stability across cycles
👉 Explore S&P Global further in Finorify app:
https://finorify.com/app/stockDetail?stockRef=SPGI
THINKING IN YEARS, NOT QUARTERS
Across Netflix, Meta, Amazon, and S&P Global, the same mistake appears again and again. Investors confuse temporary effects with permanent change.
Accounting noise fades. Investment cycles normalize. What remains is revenue growth, cash generation, and capital discipline.
Markets will always react to headlines. Long-term returns belong to those who can look past them.
Want to dig deeper into NFLX, AMZN, META, SPGI, or any other stock like this? Download the Finorify app today. It makes fundamental analysis easy on the go, so you can check earnings, cash flow, valuations, and charts anytime to spot more opportunities like these four picks for 2026. Get it now and stay ahead of the market.
Excellent piece! Well done.